| UNEMPLOYMENT
RATE |
| Social |
Chapter 3 |
Driving Force |
1. Indicator
(a) Name: Unemployment rate.
(b) Brief Definition: Unemployment rate is the ratio of unemployed
people to the labour force.
(c) Unit of Measurement: %.
2. Placement in the Framework
(a) Agenda 21: Chapter 3: Combating Poverty.
(b) Type of Indicator: Driving Force.
3. Significance (Policy Relevance)
(a) Purpose: The unemployment rate measures
the part of the labour force which, during the survey reference period,
was neither (i) at work nor temporarily absent from work (i.e. not in paid
or self- employment); (ii) available for work; or (iii) seeking work.
(b) Relevance to Sustainable/Unsustainable
Development: Unemployment is useful and relevant to measuring
sustainable development, especially if uniformly measured over time, and
considered with other socioeconomic indicators. It is one of the main
reasons for poverty in rich and medium income countries and among persons
with high education in low income countries (no work, no income but
compensation from insurance schemes or other welfare state systems
whenever they exist). It should be noted, however, that it is common to
find people working full-time but remaining poor due to the particular
social conditions and type of industrial relations prevalent in their
country, industry, or occupation.
(c) Linkages to Other Indicators: This
indicator is linked to other socioeconomic indicators such as poverty
measures and adult literacy.
(d) Targets: National targets for
unemployment are common.
(e) International Conventions and Agreements:
See 7 iii below.
4. Methodological Description and Underlying
Definitions
(a) Underlying Definitions and Concepts: The
definitions for labour force, employed population, and unemployed
population are well established by international agreements (see section 7
below).
i) Labour Force: The current economically active
population or labour force has two components: the employed and the
unemployed population. The international standard definition of labour
force established by the Thirteen International Conference of Labour
Statisticians (ILO, 1982) is based on the following elements:
--The survey population: All usual residents (de
jure population) or all persons present in the country at the time of the
survey (de facto population). Some particular groups, such as the armed
forces or other populations living in institutions, nomadic people, etc.
may be excluded.
--An age limit: In countries where compulsory
schooling and legislation on the minimum age for admission to employment
have broad coverage and are widely respected, the age specified in these
regulations may be used as a basis for determining an appropriate minimum
age limit for measuring the economically active population.
In other countries the minimum age limit should be
determined empirically on the basis of (i) the extent and intensity of
participation in economic activities by young people, and (ii) the
feasibility and cost of measuring such participation with acceptable
accuracy. Some countries also determine a maximum age for inclusion in the
labour force.
--The involvement in economic activities during the
survey reference period: The concept of economic activity adopted by the
Thirteenth International Conference of Labour Statisticians (1982) is
defined in terms of production of goods and services as set forth by the
United Nations System of National Accounts, (revised in 1993).
-- A short reference period: For example, one week
or a day.
ii) Employed population: According to the 1982
international definition of employment (ILO, 1983) the employed comprise
all persons above the age specified for measuring the labour force, who
were in the following categories:
--Paid employment: (i) at work: persons who, during
the reference period, performed some work (at least one hour) for wage or
salary, in cash or in kind; (ii) with a job but not at work: persons who,
having already worked in their present job, were temporarily not at work
during the reference period but had a formal attachment to their job;
--self-employment: (i) at work: persons who, during
the reference period, performed some work (at least one hour) for profit
or family gain, in cash or in kind; (ii) with an enterprise but not at
work : persons with an enterprise, which may be a business enterprise, a
farm or a service undertaking, who were temporarily not at work during the
reference period for some specific reason.
iii) Unemployed population: According to the 1982
international definition of employment (ILO, 1983) the unemployed comprise
all persons above the age specified for measuring the labour force, who
during the survey reference period were at the same time: (i) not in paid
employment or self-employment, not even for an hour; (ii) available for
work; and (iii) seeking work.
(b) Measurement Methods:
--Sources may be grouped into two broad categories:
(i) population censuses and household sample surveys; and (ii) various
types of administrative records, such as employment exchange registers,
unemployment insurance records or social security files, which cover
different segments of the target population (numerator of the indicator)
through different conceptual frameworks.
Estimates according to the international standards
can in practice be made most reliably on the basis of data collected
through household surveys and population censuses. Some of the criteria
specified in the international standards can only be implemented precisely
through personal interviews. This is the only data source which, on a
regular basis and with an appropriate survey design, can cover virtually
the entire population of a country, all branches of economic activity,
sectors of the economy, types of activity status and categories of workers
and which allow joint, mutually exclusive measurement of the employed,
unemployed and economically inactive.
--The one hour criterion is necessary to cover all
regular and irregular types of employment that may exist in a given
country; to have the total employment corresponding to aggregate
production; and to justify the international definition of unemployment as
a total lack of work, so that the two components of the labour force are
mutually exclusive categories.
--Temporary absence from work is a notion which
refers to situations in which a period of work is interrupted by a period
of absence, i.e. persons have already worked at their current activity and
are expected to return to their work after the period of absence.
For paid employment, temporary absence from work is
ascertained on the basis of the concept of formal job attachment according
to one or more of the following criteria: continued receipt of wage or
salary; an assurance of a return to work following the end of the
contingency, or an agreement as to the date of return; the elapsed
duration of absence from the job which, wherever relevant, may be that
duration for which workers can receive compensation benefits without
obligation to accept other jobs.
For self-employment, the concept of temporary
absence from work is based on two criteria: the continued existence of the
enterprise and the duration of absence.
--Availability for work means that, given a work
opportunity, a person should be able and ready to work during the survey
reference period. In practice, many countries prefer to use a slightly
longer reference period for availability (not everyone who is seeking work
can be expected to take up a job immediately one is offered).
--Seeking work means having taken specific active
steps in a specified recent period to seek paid employment or
self-employment. This specified period may be longer than the survey
reference period (e.g. one month or the four weeks before it) to take
account of the time-lags which often follow initial steps to obtain work,
and during which jobseekers may not take any other initiatives to find
work.
The 1982 international standards introduced a
provision which allows for the relaxation of the seeking work criterion in
situations where the conventional means of seeking work are of limited
relevance, where the labour market is largely unorganised or of limited
scope, where labour absorption is at the time inadequate, or where the
labour force is largely self-employed.
--Particular groups: (i) Future starts i.e. persons
who have made arrangements to take up paid employment or to undertake
self-employment activity at a date subsequent to the reference period, if
currently available for work, are to be considered as unemployed whether
or not they continue to seek work. (ii) Lay-offs without formal job
attachment but seeking and currently available for work are to be
classified as unemployed. (iii) Students seeking and available for work
are unemployed (the availability of full-time students seeking full-time
work, however, may be questionable). (iv) Persons seeking and available
for apprenticeship are to be classified as unemployed if the
apprenticeship is an economic activity in the sense of SNA. (v)
Beneficiaries of employment creation schemes are unemployed if the
training does not take place within the context of an enterprise nor is
associated with the productive activities of the enterprise, and no formal
job attachment exists; but there is a definite commitment to employment
after the end of the training.
(c) The Indicator in the DSR Framework: In
the DSR framework the unemployment rate (%) has been put into the Driving
Force indicators category.
(d) Limitations of the Indicator: The
concept of poverty refers to a long lasting situation while the number of
unemployed can change very fast depending of various short term
circumstances. Therefore, it may be interesting to use the concept of
usual unemployment and usual economically active population instead of
current unemployment and labour force. The difference is that the survey
reference period is a long one (e.g. one year) and that a person is to be
classified in one category (employed, unemployed or inactive) according to
the category in which he or she is classifiable for the greatest amount of
time.
National capacity to collect data related to
unemployment varies considerably. There are often severe problems with
data quality. In addition, the informal sector, and unpaid labour in, for
example, households and the agricultural sector are not captured by this
indicator.
(e) Alternative Definitions: The
unemployment rate is more meaningful when shown by age, sex and other
relevant variables such as the educational level, previous work experience
etc.
5. Assessment of the Availability of Data from
National and International Sources
(a) Data Needed to Compile the Indicator:
Labour force (total number of persons) and total number of unemployed
persons, derived from the same survey.
(b) Data Availability: The availability of
the rate of unemployment in recent years (1992, 1993 or 1994) is
ascertained for 80 countries. The sources are labour force surveys or
general household surveys for 57 countries (3 do not give the distribution
by gender; 15 also use employment office statistics of which 13 provide
the distribution by gender); employment office statistics exclusively for
18 countries (5 do not give the distribution by gender); and official
estimates for 4 countries (3 give the distribution by gender).
(c) Data Sources: See section 7i below.
6. Agencies Involved in the Development of the
Indicator
The lead agency involved is the International
Labour Office (ILO) of the United Nations, located in Geneva. The contact
point is the Focal Point for Environment and Sustainable Development, ILO;
fax no. (41-22) 798 8685.
7. Further Information
(a) Data:
Yearbook of Labour Statistics, ILO, Geneva;
Bulletin of Labour Statistics (quarterly) and its
Supplement (January/February, April/May, July/August and
October/November), ILO, Geneva;
Statistical yearbooks and other publications issued
by the national statistical offices.
(b) Methodology:
Surveys of Economically Active Population,
Employment, Unemployment and Underemployment -An ILO Manual on Concepts
and Methods, ILO, Geneva, 1992.
Sources and Methods: Labour Statistics, Volumes 3
and 5, ILO, Geneva, 1991 and 1990, currently updated.
System of National Accounts 1993, Commission of the
European Communities, International Monetary Fund, Organisation for
Economic Co-operation and Development, United Nations, World Bank,
Brussels/Luxembourg, New York, Paris, Washington, D.C., 1993;
Current international recommendations on labour
statistics, ILO, Geneva, 1988. See particularly the Resolution Concerning
Statistics of the Economically Active Population, Employment, Unemployment
and Underemployment, adopted by the Thirteenth International Conference of
Labour Statisticians (October 1982).
(c) International Conventions and
Recommendations:
Labour Statistics Convention (No. 160) and
Recommendation (No. 170), 1985.
| HEAD COUNT
INDEX OF POVERTY |
| Social |
Chapter 3 |
State |
1. Indicator
(a) Name: Head Count Index of Poverty.
(b) Brief Definition: The proportion of the population with a
standard of living below the poverty line.
(c) Unit of Measurement: %.
2. Placement in the Framework
(a) Agenda 21: Chapter 3: Combating Poverty.
(b) Type of Indicator: State.
3. Significance (Policy Relevance)
(a) Purpose: The most important purpose of a
poverty measure is to enable poverty comparisons. These are required for
an overall assessment of a country's progress in poverty alleviation
and/or the evaluation of specific policies or projects. An important case
of a poverty comparison is the poverty profile which shows how the
aggregate poverty measure can be decomposed into poverty measures for
various sub-groups of the population, such as by region of residence,
employment sector, education level, or ethnic group. A good poverty
profile can help reveal a number of aspects of poverty-reduction policies,
such as the regional or sectoral priorities for public spending. Poverty
comparisons are also made over time, in assessing overall performance from
the point of view of the poor.
(b) Relevance to Sustainable/Unsustainable
Development: Measures of poverty are a very significant consideration
of sustainable development. The eradication of poverty remains a major
challenge for policy decision makers. Furthermore, an integrative
viewpoint which simultaneously takes account of development issues,
resource use and environmental quality, and human welfare must be taken if
sustainable progress is to be achieved.
The Head Count Index of poverty captures the
prevalence of poverty by measuring the proportion of population for whom
consumption (or any other suitable measure of living standard) is below
the poverty line. An increase in this indicator implies a worsening of the
poverty situation with a greater proportion of the population falling
below the poverty line.
(c) Linkages to Other Indicators: In
general, this indicator is linked to many other sustainable development
measures, for example, net migration rate, adult literacy rate, Gross
Domestic Product per capita, and population living below the poverty line
in dryland areas. In particular, the Head Count Index is closely
associated to the Poverty Gap Index and the Squared Poverty Gap Index
which capture successively more detailed aspects of the poverty situation.
The Head Count Index measures how widespread poverty is, the Poverty Gap
Index measures how poor the poor are, and the Squared Poverty Gap Index
measures the severity of poverty by giving more weight to the poorest of
the poor.
(d) Targets: Not available.
(e) International Conventions and Agreements:
Not available.
4. Methodological Description and Underlying
Definitions
(a) Underlying Definitions and Concepts: A
poverty measure is a summary statistic on the economic welfare of the poor
in a society. There is no one universally accepted single measure of
poverty. A number of different approaches exist (see, for example, the
methodology sheets for the Poverty Gap Index and the Squared Poverty Gap
Index). This methodology sheet guides the reader along certain key issues,
such as the different approaches to measuring individual welfare, without
prescribing decisions. Consequently, it is directed at comparability over
time within a given country, as it helps national practitioners specify
poverty indicators that match their specific situation and preferred
approach. However, this is at the expense of international comparability.
To compute poverty measures, the following
questions related to identifying and defining the poor must be addressed
first:
i) How do we measure an individual's economic
welfare?
ii) At what level of measured welfare is a person
considered poor?
(b) Measurement Methods: The Head Count
Index (H) is the proportion of the population whose economic welfare (y)
is less than the poverty line (z). If q people are deemed to be poor in a
population of size n then H=q/n. For computing the Head Count Index,
estimates of individual economic welfare and the poverty line are
required.
i) Measuring Individual Welfare: There are a number
of different approaches to measuring welfare. The approaches differ in
terms of the importance attached to the individual's own judgment of
well-being versus a concept of welfare decided upon by somebody else. The
former would focus on measuring an individual's consumption of a bundle of
goods and services. An example of the latter would be defining welfare by
the level of nutritional intake, even though people do not live on food
alone, or make food choices solely on the basis of nutrition. Approaches
in practice also differ according to how difficult it is to obtain certain
types of data in specific settings.
Typically one finds that poverty comparisons in
developing countries put a high weight on nutritional attainments,
consistent with the behaviour of poor people in a specific society. A
comprehensive measure of consumption (for example, total expenditure on
all goods and services consumed, including non-market goods, such as
consumption from a farmer's own product) has been more popular than using
current income in the development literature. This is due in part to the
fact that incomes are harder to measure accurately. Current consumption is
also likely to give a better indication than current income of a
household's typical, long-term, economic welfare; income may fluctuate
greatly over time, particularly in rural economies (see Ravallion
reference in section 7a below).
The following methods can be used for measuring
individual standards of living:
--Consumption per equivalent male adult: Since
households differ in size and composition, a simple comparison of
aggregate household consumption can be misleading about the welfare of
individual members of the household. Therefore, for any given household,
an equivalence scale is used to approximate the number of single adults,
based on observed consumption behaviour. There are a number of value
judgments embedded in this practice; for example, differences in needs are
reflected in differences in consumption. Adult females and children are
assigned a male equivalence of less than one since they typically consume
less; however, that may not mean that they have lower "needs"
but rather have less power within the household. The existence of size
economies in consumption may also mean that two people can live more
cheaply together than apart (for a further discussion of these issues, see
Ravallion reference in section 7a below).
--Undernutrition: This is a distinct concept,
although closely associated with poverty. Undernutrition can be viewed as
a specific type of poverty, namely food energy poverty. There are a number
of arguments for and against using this as a measure of well-being. A
practical advantage is that this measure does not have to be adjusted for
inflation and would not be constrained by any inadequacy of price data.
Measures of child nutritional status can help capture aspects of welfare,
such as distribution within the household which are not adequately
reflected in other indicators. However, nutrition is not the only aspect
that matters to the well-being of people, including the poor. Thus,
poverty comparisons based solely on nutrition alone may be limited and
deceptive.
ii) Defining the Poverty Line: In practice, there
are a number of alternative approaches to defining poverty lines:
--Absolute poverty lines: An absolute poverty line
is one which is fixed in terms of the living standard indicator being used
(consumption, nutrition). It is fixed over the entire domain of
comparison, that is, a poverty line which assures the same level of
economic welfare would be used to measure and compare poverty across
provinces or different situations. The poverty line may still vary, but
only so as to measure the differences in the cost of a given level of
welfare. Absolute poverty lines are more common in developing country
literature.
The most common approach to defining absolute
poverty lines is to estimate the cost in each region or at each date of a
certain bundle of goods necessary to attain basic consumption needs (this
is called the basic needs approach). The most important component of basic
needs is a recommended food energy intake, supplemented by essential
non-food goods. To measure food energy requirements, one needs to make an
assumption about activity levels which in turn determine energy
requirements to maintain the body's metabolic rate at rest. Once the food
energy intake has been determined, and its cost has been calculated, an
allowance for non-food spending can be added by finding the total
expenditure level at which a person typically attains the food component
of the poverty line. An alternative (lower) allowance for non-food goods
is to use the average non-food spending of people who can just afford the
food component of the poverty line: it can be argued that this is a
reasonable lower bound for the non-food component of the poverty line (see
Ravallion reference in section 7a below).
--Relative poverty lines: These have dominated
developed country literature where many studies have used a poverty line
which is set at, for example, 50% of the national mean income. When the
poverty line is fixed as a proportion of the national mean, if all incomes
increase by the same proportion, there would be no change in relative
inequalities and the poverty line would simply increase by the same
proportion; that is, the poverty measure will not change. This can make
such poverty lines deceptive for some purposes, such as assessing whether
poor people are better or worse off.
A cross-country comparison of 36 countries, both
developed and developing, revealed that real poverty lines will tend to
increase with economic growth, but they will do so slowly for the poorest
countries. Therefore, the concept of absolute poverty appears to be more
relevant to low income countries, while relative poverty is of more
relevance to high income countries.
(c) The Indicator in the DSR Framework: In
the DSR Framework, this indicator represents a measure of the State of
poverty.
(d) Limitations of the Indicator: In
practice, most applications in developing countries have used consumption
per person. This probably overstates the extent to which poverty is
associated with larger family sizes. But other aspects of the poverty
profile (such as assessments of the regional or sectoral poverty profiles)
tend to be more robust as a measurement choice.
It is important to note that a certain amount of
arbitrariness and value judgement are unavoidable in defining individual
welfare and any poverty line. Therefore, the overall assessment of the
poverty situation should pay particularly attention to how the choices
made affect poverty comparisons, since these are generally what matter
most to policy implications. An increasingly common practice is to
recalculate the poverty measures using various poverty lines, and to test
whether the qualitative poverty comparisons are robust to the choice.
It should be noted that there are several
comparability problems across countries in the use of data from household
surveys (see section 5 below). In addition, definitions of poverty are
lacking in some countries or vary from country to country. These problems
are diminishing over time as survey methodologies are improving and
becoming more standardized, but they remain.
(e) Alternative Definitions: The Poverty Gap
Index and the Squared Poverty Gap Index represent alternative definitions
for a poverty indicator (see section 3c above and the relevant methodology
sheets for these indicators).
5. Assessment of the Availability of Data from
International and National Sources
The most important source of data on living
standards is household surveys. The results of these surveys can be
obtained from government statistical agencies, often via published
reports. About two thirds of the developing countries have done sample
household surveys which are representative nationally, and some (but
certainly not all) of these provide high-quality data on living standards.
Data can also be obtained from international
agencies such as The World Bank (mostly data for low and middle income
countries emerging from the Living Standards Measurement Study and Social
Dimensions of Adjustment Project for Sub Saharan Africa). Data for
developed countries can be obtained from the Statistical Office of the
European Union (Eurostat), the Luxembourg Income Study, or the
Organisation for Economic Co-operation and Development (OECD).
6. Agencies Involved in the Development of the
Indicator
The lead agency involved is The World Bank (WB).
The contact point is the Chief, Indicators and Environmental Valuation
Unit, Environment Department, WB; fax no. (1-202) 477 0968.
7. Further Information
(a) Further Readings:
Ravallion, M. Poverty Comparisons. Fundamentals in
Pure and Applied Economics, Volume 56, Harwood Academic Press,
Switzerland. 1994.
POVERTY GAP INDEX |
| Social |
Chapter 3 |
State |
1. Indicator
(a) Name: Poverty Gap Index.
(b) Brief Definition: The mean over the
population of the proportionate poverty gap, where the poverty gap is
given by the distance of the poor below the poverty line, as a proportion
of the line. The non-poor are counted as having zero poverty gap.
(c) Unit of Measurement: Fraction bounded by
0 and the Head Count Index.
2. Placement in the Framework
(a) Agenda 21: Chapter 3: Combating Poverty.
(b) Type of Indicator: State.
3. Significance (Policy Relevance)
(a) Purpose: The most important purpose of a
poverty measure is to enable poverty comparisons. These are required for
an overall assessment of a country's progress in poverty alleviation
and/or the evaluation of specific policies or projects. An important case
of a poverty comparison is the poverty profile which shows how the
aggregate poverty measure can be decomposed into poverty measures for
various sub-groups of the population, such as by region of residence,
employment sector, education level, or ethnic group. A good poverty
profile can help reveal a number of aspects of poverty-reduction policies,
such as the regional or sectoral priorities for public spending. Poverty
comparisons are also made over time, in assessing overall performance from
the point of view of the poor.
(b) Relevance to Sustainable/Unsustainable
Development: Measures of poverty are a very significant consideration
of sustainable development. The eradication of poverty remains a major
challenge for policy decision makers. Furthermore, an integrative
viewpoint which simultaneously takes account of development issues,
resource use and environmental quality, and human welfare must be taken if
sustainable progress is to be achieved.
The Poverty Gap Index measures the depth of poverty
in a country or region, based on the aggregate poverty deficit of the poor
relative to the poverty line. Since the Head Count Index (see section 3c
below) is not sensitive to changes in the status of those already below
the poverty line, it is inadequate in assessing the impact of specific
policies on the poor. On the other hand, the Poverty Gap Index increases
with the distance of the poor below the poverty line, and thus gives a
good indication of the depth of poverty. A decline in the Poverty Gap
Index reflects an improvement in the current situation.
(c) Linkages to Other Indicators: In
general, this indicator is linked to many other sustainable development
measures, for example, net migration rate, adult literacy rate, Gross
Domestic Product per capita, and population living below the poverty line
in dryland areas. More specifically, the poverty measures discussed in
this and two other methodology sheets; namely the Head Count Index, the
Poverty Gap Index, and the Squared Poverty Gap Index; capture successively
more detailed aspects of the poverty situation. The Head Count Index
measures how widespread poverty is, the Poverty Gap Index measures how
poor the poor are, and the Squared Poverty Gap Index measures the severity
of poverty by giving more weight to the poorest of the poor.
(d) Targets: Not available.
(e) International Conventions and Agreements:
Not available.
4. Methodological Description and Underlying
Definitions
(a) Underlying Definitions and Concepts: A
poverty measure is a summary statistic on the economic welfare of the poor
in a society. There is no one universally accepted single measure of
poverty. A number of different approaches exist (see, for example, the
methodology sheets for the Poverty Gap Index and the Squared Poverty Gap
Index). This methodology sheet guides the reader along certain key issues,
such as the different approaches to measuring individual welfare, without
prescribing decisions. Consequently, it is directed at comparability over
time within a given country, as it helps national practitioners specify
poverty indicators that match their specific situation and preferred
approach. However, this is at the expense of international comparability.
To compute poverty measures, the following
questions related to identifying and defining the poor must be addressed
first:
i) How do we measure an individual's economic
welfare?
ii) At what level of measured welfare is a person considered poor?
(b) Measurement Methods: The Poverty Gap
Index is the mean across the population of a household poverty measure
(weighted by household-size). The Index takes the value zero if the
average economic welfare (for example, consumption) is above the poverty
line, and is measured by the function 1-y/z if it is at or below the line,
where z is the poverty line and y denotes the mean consumption of the
poor. For computing the Poverty Gap Index, estimates of individual
economic welfare (y), and the poverty line (z) are required.
i) Measuring Individual Welfare: There are a number
of different approaches to measuring welfare. The approaches differ in
terms of the importance attached to the individual's own judgment of
well-being versus a concept of welfare decided upon by somebody else. The
former would focus on measuring an individual's consumption of a bundle of
goods and services. An example of the latter would be defining welfare by
the level of nutritional intake, even though people do not live on food
alone, or make food choices solely on the basis of nutrition. Approaches
in practice also differ according to how difficult it is to obtain certain
sorts of data in specific settings.
Typically one finds that poverty comparisons in
developing countries put a high weight on nutritional attainments,
consistent with the behaviour of poor people in a specific society. A
comprehensive measure of consumption (for example, total expenditure on
all goods and services consumed, including non-market goods, such as
consumption from a farmer's own product) has been more popular than using
current income in the development literature. This is due in part to the
fact that incomes are harder to measure accurately. Current consumption is
also likely to give a better indication than current income of a
household's typical, long-term, economic welfare; income may fluctuate
greatly over time, particularly in rural economies (see Ravallion
reference in section 7a below).
The following methods can be used for measuring
individual standards of living:
--Consumption per equivalent male adult: Since
households differ in size and composition, a simple comparison of
aggregate household consumption can be misleading about the welfare of
individual members of the household. Therefore, for any given household,
an equivalence scale is used to approximate the number of single adults,
based on observed consumption behaviour. There are a number of value
judgments embedded in this practice; for example, differences in needs are
reflected in differences in consumption. Adult females and children are
assigned a male equivalence of less than one since they typically consume
less; however, that may not mean that they have lower "needs"
but rather have less power within the household. The existence of size
economies in consumption may also mean that two people can live more
cheaply together than apart (for a further discussion of these issues, see
Ravallion reference in section 7a below).
--Undernutrition: This is a distinct concept,
although closely associated with poverty. Undernutrition can be viewed as
a specific type of poverty, namely food energy poverty. There are a number
of arguments for and against using this as a measure of well-being. A
practical advantage is that this measure does not have to be adjusted for
inflation and would not be constrained by any inadequacy of price data.
Measures of child nutritional status can help capture aspects of welfare,
such as distribution within the household which are not adequately
reflected in other indicators. However, nutrition is not the only aspect
that matters to the well-being of people, including the poor. Thus,
poverty comparisons based solely on nutrition alone may be limited and
deceptive.
ii) Defining the Poverty Line: In practice, there
are a number of alternative approaches to defining poverty lines:
--Absolute poverty lines: An absolute poverty line
is one which is fixed in terms of the living standard indicator being used
(consumption, nutrition). It is fixed over the entire domain of
comparison, that is, a poverty line which assures the same level of
economic welfare would be used to measure and compare poverty across
provinces or different situations. The poverty line may still vary, but
only so as to measure the differences in the cost of a given level of
welfare. Absolute poverty lines are more common in developing country
literature.
The most common approach to defining absolute
poverty lines is to estimate the cost in each region or at each date of a
certain bundle of goods necessary to attain basic consumption needs (this
is called the basic needs approach). The most important component of basic
needs is a recommended food energy intake, supplemented by essential
non-food goods. To measure food energy requirements, one needs to make an
assumption about activity levels which in turn determine energy
requirements to maintain the body's metabolic rate at rest. Once the food
energy intake has been determined, and its cost has been calculated, an
allowance for non-food spending can be added by finding the total
expenditure level at which a person typically attains the food component
of the poverty line. An alternative (lower) allowance for non-food goods
is to use the average non-food spending of people who can just afford the
food component of the poverty line: it can be argued that this is a
reasonable lower bound for the non-food component of the poverty line (see
Ravallion reference in section 7a below).
--Relative poverty lines: These have dominated
developed country literature where many studies have used a poverty line
which is set at, for example, 50% of the national mean income. When the
poverty line is fixed as a proportion of the national mean, if all incomes
increase by the same proportion, there would be no change in relative
inequalities and the poverty line would simply increase by the same
proportion; that is, the poverty measure will not change. This can make
such poverty lines deceptive for some purposes, such as assessing whether
poor people are better or worse off.
A cross-country comparison of 36 countries, both
developed and developing, revealed that real poverty lines will tend to
increase with economic growth, but they will do so slowly for the poorest
countries. Therefore, the concept of absolute poverty appears to be more
relevant to low income countries, while relative poverty is of more
relevance to high income countries.
(c) The Indicator in the DSR Framework: In
the DSR Framework, this indicator represents a measure of the State of
poverty.
(d) Limitations of the Indicator: In
practice, most applications in developing countries have used consumption
per person. This probably overstates the extent to which poverty is
associated with larger family sizes. But other aspects of the poverty
profile (such as assessments of the regional or sectoral poverty profiles)
tend to be more robust as a measurement choice.
It is important to note that a certain amount of
arbitrariness and value judgement are unavoidable in defining individual
welfare and any poverty line. Therefore, the overall assessment of the
poverty situation should pay particularly attention to how the choices
made affect poverty comparisons, since these are generally what matter
most to policy implications. An increasingly common practice is to
recalculate the poverty measures using various poverty lines, and to test
whether the qualitative poverty comparisons are robust to the choice.
It should be noted that there are several
comparability problems across countries in the use of data from household
surveys (see section 5 below). In addition, definitions of poverty are
lacking in some countries or vary from country to country. These problems
are diminishing over time as survey methodologies are improving and
becoming more standardized, but they remain.
(e) Alternative Definitions: The Head Count
Index and the Squared Poverty Gap Index represent alternative definitions
for a poverty indicator (see section 3c above and the relevant methodology
sheets for these indicators).
5. Assessment of the Availability of Data from
International and National Sources
The most important source of data on living
standards is household surveys. The results of these surveys can be
obtained from government statistical agencies, often via published
reports. About two thirds of the developing countries have done sample
household surveys which are representative nationally, and some (but
certainly not all) of these provide high-quality data on living standards.
Data can also be obtained from international
agencies such as The World Bank (mostly data for low and middle income
countries emerging from the Living Standards Measurement Study and Social
Dimensions of Adjustment Project for Sub Saharan Africa). Data for
developed countries can be obtained from the Statistical Office of the
European Union (Eurostat), the Luxembourg Income Study, or the
Organisation for Economic Co-operation and Development (OECD).
6. Agencies Involved in the Development of the
Indicator
The lead agency involved is The World Bank (WB).
The contact point is the Chief, Indicators and Environmental Valuation
Unit, Environment Department, WB; fax no. (1-202) 477 0968.
7. Further Information
(a) Further Readings:
Ravallion, M. Poverty Comparisons. Fundamentals in
Pure and Applied Economics, Volume 56, Harwood Academic Press,
Switzerland. 1994.
| SQUARED
POVERTY GAP INDEX |
| Social |
Chapter 3 |
State |
1. Indicator
(a) Name: Squared Poverty Gap Index.
(b) Brief Definition: The mean of the
squared proportionate poverty gap.
(c) Unit of Measurement: Fraction bounded by
0 and the Poverty Gap Index.
2. Placement in the Framework
(a) Agenda 21: Chapter 3: Combating Poverty.
(b) Type of Indicator: State.
3. Significance (Policy Relevance)
(a) Purpose: The most important purpose of a
poverty measure is to enable poverty comparisons. These are required for
an overall assessment of a country's progress in poverty alleviation
and/or the evaluation of specific policies or projects. An important case
of a poverty comparison is the poverty profile which shows how the
aggregate poverty measure can be decomposed into poverty measures for
various sub-groups of the population, such as by region of residence,
employment sector, education level, or ethnic group. A good poverty
profile can help reveal a number of aspects of poverty-reduction policies,
such as the regional or sectoral priorities for public spending. Poverty
comparisons are also made over time, in assessing overall performance from
the point of view of the poor.
(b) Relevance to Sustainable/Unsustainable
Development: Measures of poverty are a very significant consideration
of sustainable development. The eradication of poverty remains a major
challenge for policy decision makers. Furthermore, an integrative
viewpoint which simultaneously takes account of development issues,
resource use and environmental quality, and human welfare must be taken if
sustainable progress is to be achieved.
In addition to the Head Count and Poverty Gap
Indices, a third measure which better reflects changes in the severity of
poverty is the Squared Poverty Gap Index. This is defined similar to the
Poverty Gap Index except that the poverty gaps are squared, thus giving
the highest weighting to the largest poverty gap. The need for this Index
arises because the Poverty Gap Index may not adequately capture concerns
over distribution changes within the poor. For example, if a policy
resulted in money transfer from someone just below the poverty line to the
poorest person, the Squared Poverty Gap Index will reflect this change,
while the Poverty Gap Index will not.
(c) Linkages to Other Indicators: In
general, this indicator is linked to many other sustainable development
measures, for example, net migration rate, adult literacy rate, Gross
Domestic Product per capita, and population living below the poverty line
in dryland areas. More specifically, the poverty measures discussed in
this and two other methodology sheets; namely the Head Count Index, the
Poverty Gap Index, and the Squared Poverty Gap Index; capture successively
more detailed aspects of the poverty situation. The Head Count Index
measures how widespread poverty is, the Poverty Gap Index measures how
poor the poor are, and the Squared Poverty Gap Index measures the severity
of poverty by giving more weight to the poorest of the poor.
(d) Targets: Not available.
(e) International Conventions and Agreements:
Not available.
4. Methodological Description and Underlying
Definitions
(a) Underlying Definitions and Concepts: A
poverty measure is a summary statistic on the economic welfare of the poor
in a society. There is no one universally accepted single measure of
poverty. A number of different approaches exist (see, for example, the
methodology sheets for the Poverty Gap Index and the Squared Poverty Gap
Index). This methodology sheet guides the reader along certain key issues,
such as the different approaches to measuring individual welfare, without
prescribing decisions. Consequently, it is directed at comparability over
time within a given country, as it helps national practitioners specify
poverty indicators that match their specific situation and preferred
approach. However, this is at the expense of international comparability.
To compute poverty measures, the following
questions related to identifying and defining the poor must be addressed
first:
i) How do we measure an individual's economic
welfare?
ii) At what level of measured welfare is a person
considered poor?
(b) Measurement Methods: The Squared Poverty
Gap Index is the mean of a measure (weighted by household-size) that is
zero if the household's welfare (y) is above the poverty line (z), and
represented by the squared poverty gap, that is [1-y/z] x [1-y/z], if y is
at or below z.
For computing the above indicator, estimates of
individual economic welfare (y), and the poverty line (z) are required.
i) Measuring Individual Welfare: There are a number
of different approaches to measuring welfare. The approaches differ in
terms of the importance attached to the individual's own judgment of
well-being versus a concept of welfare decided upon by somebody else. The
former would focus on measuring an individual's consumption of a bundle of
goods and services. An example of the latter would be defining welfare by
the level of nutritional intake, even though people do not live on food
alone, or make food choices solely on the basis of nutrition. Approaches
in practice also differ according to how difficult it is to obtain certain
sorts of data in specific settings.
Typically one finds that poverty comparisons in
developing countries put a high weight on nutritional attainments,
consistent with the behaviour of poor people in a specific society. A
comprehensive measure of consumption (for example, total expenditure on
all goods and services consumed, including non-market goods, such as
consumption from a farmer's own product) has been more popular than using
current income in the development literature. This is due in part to the
fact that incomes are harder to measure accurately. Current consumption is
also likely to give a better indication than current income of a
household's typical, long-term, economic welfare; income may fluctuate
greatly over time, particularly in rural economies (see Ravallion
reference in section 7a below).
The following methods can be used for measuring
individual standards of living:
--Consumption per equivalent male adult: Since
households differ in size and composition, a simple comparison of
aggregate household consumption can be misleading about the welfare of
individual members of the household. Therefore, for any given household,
an equivalence scale is used to approximate the number of single adults,
based on observed consumption behaviour. There are a number of value
judgments embedded in this practice; for example, differences in needs are
reflected in differences in consumption. Adult females and children are
assigned a male equivalence of less than one since they typically consume
less; however, that may not mean that they have lower "needs"
but rather have less power within the household. The existence of size
economies in consumption may also mean that two people can live more
cheaply together than apart (for a further discussion of these issues, see
Ravallion reference in section 7a below).
--Undernutrition: This is a distinct concept,
although closely associated with poverty. Undernutrition can be viewed as
a specific type of poverty, namely food energy poverty. There are a number
of arguments for and against using this as a measure of well-being. A
practical advantage is that this measure does not have to be adjusted for
inflation and would not be constrained by any inadequacy of price data.
Measures of child nutritional status can help capture aspects of welfare,
such as distribution within the household which are not adequately
reflected in other indicators. However, nutrition is not the only aspect
that matters to the well-being of people, including the poor. Thus,
poverty comparisons based solely on nutrition alone may be limited and
deceptive.
ii) Defining the Poverty Line: In practice, there
are a number of alternative approaches to defining poverty lines:
--Absolute poverty lines: An absolute poverty line
is one which is fixed in terms of the living standard indicator being used
(consumption, nutrition). It is fixed over the entire domain of
comparison, that is, a poverty line which assures the same level of
economic welfare would be used to measure and compare poverty across
provinces or different situations. The poverty line may still vary, but
only so as to measure the differences in the cost of a given level of
welfare. Absolute poverty lines are more common in developing country
literature.
The most common approach to defining absolute
poverty lines is to estimate the cost in each region or at each date of a
certain bundle of goods necessary to attain basic consumption needs (this
is called the basic needs approach). The most important component of basic
needs is a recommended food energy intake, supplemented by essential
non-food goods. To measure food energy requirements, one needs to make an
assumption about activity levels which in turn determine energy
requirements to maintain the body's metabolic rate at rest. Once the food
energy intake has been determined, and its cost has been calculated, an
allowance for non-food spending can be added by finding the total
expenditure level at which a person typically attains the food component
of the poverty line. An alternative (lower) allowance for non-food goods
is to use the average non-food spending of people who can just afford the
food component of the poverty line: it can be argued that this is a
reasonable lower bound for the non-food component of the poverty line (see
Ravallion reference in section 7a below).
--Relative poverty lines: These have dominated
developed country literature where many studies have used a poverty line
which is set at, for example, 50% of the national mean income. When the
poverty line is fixed as a proportion of the national mean, if all incomes
increase by the same proportion, there would be no change in relative
inequalities and the poverty line would simply increase by the same
proportion; that is, the poverty measure will not change. This can make
such poverty lines deceptive for some purposes, such as assessing whether
poor people are better or worse off.
A cross-country comparison of 36 countries, both
developed and developing, revealed that real poverty lines will tend to
increase with economic growth, but they will do so slowly for the poorest
countries. Therefore, the concept of absolute poverty appears to be more
relevant to low income countries, while relative poverty is of more
relevance to high income countries.
(c) The Indicator in the DSR Framework: In
the DSR Framework, this indicator represents a measure of the State of
poverty.
(d) Limitations of the Indicator: In
practice, most applications in developing countries have used consumption
per person. This probably overstates the extent to which poverty is
associated with larger family sizes. But other aspects of the poverty
profile (such as assessments of the regional or sectoral poverty profiles)
tend to be more robust as a measurement choice.
It is important to note that a certain amount of
arbitrariness and value judgement are unavoidable in defining individual
welfare and any poverty line. Therefore, the overall assessment of the
poverty situation should pay particularly attention to how the choices
made affect poverty comparisons, since these are generally what matter
most to policy implications. An increasingly common practice is to
recalculate the poverty measures using various poverty lines, and to test
whether the qualitative poverty comparisons are robust to the choice.
It should be noted that there are several
comparability problems across countries in the use of data from household
surveys (see section 5 below). In addition, definitions of poverty are
lacking in some countries or vary from country to country. These problems
are diminishing over time as survey methodologies are improving and
becoming more standardized, but they remain.
(e) Alternative Definitions: The Head Count
Index and the Poverty Gap Index represent alternative definitions for a
poverty indicator (see section 3c above and the relevant methodology
sheets for these indicators).
5. Assessment of the Availability of Data from
International and National Sources
The most important source of data on living
standards is household surveys. The results of these surveys can be
obtained from government statistical agencies, often via published
reports. About two thirds of the developing countries have done sample
household surveys which are representative nationally, and some (but
certainly not all) of these provide high-quality data on living standards.
Data can also be obtained from international
agencies such as The World Bank (mostly data for low and middle income
countries emerging from the Living Standards Measurement Study and Social
Dimensions of Adjustment Project for Sub Saharan Africa). Data for
developed countries can be obtained from the Statistical Office of the
European Union (Eurostat), the Luxembourg Income Study, or the
Organisation for Economic Co-operation and Development (OECD).
6. Agencies Involved in the Development of the
Indicator
The lead agency involved is The World Bank (WB).
The contact point is the Chief, Indicators and Environmental Valuation
Unit, Environment Department, WB; fax no. (1-202) 477 0968.
7. Further Information
(a) Further Readings:
Ravallion, M. Poverty Comparisons. Fundamentals in
Pure and Applied Economics, Volume 56, Harwood Academic Press,
Switzerland. 1994.
| GINI INDEX OF
INCOME INEQUALITY |
| Social |
Chapter 3 |
State |
1. Indicator
(a) Name: Gini Index of Income Inequality.
(b) Brief Definition: A summary measure of
the extent to which the actual distribution of income, consumption
expenditure, or a related variable, differs from a hypothetical
distribution in which each person receives an identical share.
(c) Unit of Measurement: A dimensionless
index scaled to vary from a minimum of zero to a maximum of one; zero
representing no inequality and one representing the maximum possible
degree of inequality.
2. Placement in the Framework
(a) Agenda 21: Chapter 3: Combating Poverty.
(b) Type of Indicator: State.
3. Significance (Policy Relevance)
(a) Purpose: The Gini Index provides a
measure of income or resource inequality within a population. It is the
most popular measure of income inequality.
(b) Relevance to Sustainable/Unsustainable
Development: This indicator is particularly relevant to the equity
component of sustainable development. Income or resource distribution have
direct consequences on the poverty rate of a country or region. Broadly
speaking, average material welfare can be defined by the per capita Gross
Domestic Product (GDP). However, statistical averages can mask the
diversity that exists within any country. Therefore, from a sustainable
development perspective, it is informative to examine income and wealth
distribution throughout a population. A country can, for example, have a
high per capita GDP figure, but its income distribution so skewed that the
majority of people are poor. This indicator is useful both to measure
changes in income inequality over time and for international comparisons.
(c) Linkages to Other Indicators: This
indicator is linked to several other sustainable development measures,
including the poverty indicators, women per 100 men in the labour force,
GDP per capita, population dynamics in mountain areas, and sustainable
development strategies.
(d) Targets: Not available.
(e) International Conventions and Agreements:
Not available.
4. Methodological Description and Underlying
Definitions
(a) Underlying Definitions and Concepts:
The concept and definition of this indicator are well understood and
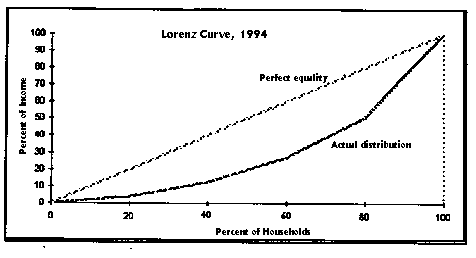
readily available. The Gini Index measures the area between the Lorenz
Curve and a hypothetical line of absolute equality, expressed as a
percentage of the maximum area under the line of perfect equality (see
Figure 1 in section 4b below). The Gini Index is defined as one half of
the average value of the absolute differences between all possible pairs
of "incomes".
(b) Measurement Methods: The Lorenz Curve
plots the cumulative percentages of total income received (on the vertical
axis) against the cumulative percentage of recipients, starting with the
poorest individual or household (see Figure 1).
Figure 1: The Lorenz Curve and Gini Index of Income
There are a number of choices about data which can
influence the precise value of the Gini Index obtained. For example, a
Gini Index for consumption expenditure will typically be lower in value
than one for income, even within the same population. This is because
households smooth their consumption over time in response to income
changes. At any one date, there will be some households with unusually low
incomes and others with unusually high ones; with some opportunities for
saving and/or borrowing. Thus, household consumption will be less unequal.
It is important how "income" is measured,
for example whether it is total household income or per capita household
income, or income per equivalent adult. In addition, it matters whether or
not the incomes are weighted by household size, since households with
lower income per person tend to be larger. Thus, the income share of the
poorest 20% of households will be higher than the income share of the
poorest 20% of persons.
The World Bank, for example, prefers to weight by
household size and calculate the shares held by persons rather than
households for most purposes. As a general rule, the Bank also considers
consumption expenditure to be the more reliable indicator of welfare than
income, which can be excessively variable over time, and is also more
difficult to measure accurately, particularly in developing countries.
Looking at the sample of 67 low and middle income countries for which Gini
indices of income are reported in the World Bank's draft report World
Development Indicators, this coefficient ranges from a low of 22% to a
high value of 64%.
There are a number of ways of estimating the Gini
Index of income, and the choice depends in part on the type of data
available. Distributional data are often available in grouped form, such
as the income share of the lowest decile of households, where households
are ranked by income per person. To estimate the Lorenz Curve, and thus
the Gini Index, from such data, the World Bank often uses a software
package called POVCAL. Having specified the type of data, the program
calculates both the General Quadratic specification for the Lorenz Curve
and the Beta specification. It then calculates the Gini Index and various
other statistics, including poverty measures for each Lorenz Curve. The
program also advises which is the better specification for the Lorenz
Curve for the specific data used.
(c) The Indicator in the DSR Framework: In
the DSR Framework, this indicator represents a measure of the State of
income inequality.
(d) Limitations of the Indicator: The Gini
Index is not a very discriminating indicator. Two very different
distributions--one having more inequality amongst the poor, the other
having more amongst the rich--can have exactly the same Gini Index.
Measurement errors in data sets are thought to be
greater for incomes compared to consumption expenditure, which will add to
measured inequality (see section 4b above). Differences between countries
in the measured Gini index may thus reflect in part differences in the
welfare measures used.
While the Gini Index of income (in common with most
other measures of inequality) captures information on the pattern of
relative levels of wellbeing in the population, it is independent of any
considerations of absolute living standards. So there is nothing to
guarantee that a lower Gini Index of income entails higher social welfare
in any agreed sense, since the mean income may have also fallen. The Gini
Index is at best a partial indicator, and other measures will be needed to
complete the picture of how levels of economic welfare are evolving in a
society.
It should be noted that there are several
comparability problems across countries in the use of data from household
surveys (see section 5 below). These problems are diminishing over time as
survey methodologies are improving and becoming more standardized, but
they remain.
(e) Alternative Definitions: There are many
other measures of inequality, with various strengths and weaknesses. These
are discussed in Sen (1973) (see section 7a below).
5. Assessment of the Availability of Data from
International and National Sources
The most important source of data on living
standards is household surveys. The results of these surveys can be
obtained from government statistical agencies, often via published
reports. About two thirds of the developing countries have done sample
household surveys which are representative nationally, and some (but
certainly not all) of these provide high-quality data on living standards.
Data can also be obtained from international
agencies such as The World Bank (mostly data for low and middle income
countries emerging from the Living Standards Measurement Study and Social
Dimensions of Adjustment Project for Sub Saharan Africa). Data for
developed countries can be obtained from the Statistical Office of the
European Union (Eurostat), the Luxembourg Income Study, or the
Organisation for Economic Co-operation and Development (OECD).
6. Agencies Involved in the Development of the
Indicator
The lead agency involved is The World Bank (WB).
The contact point is the Chief, Indicators and Environmental Valuation
Unit, Environment Department, WB; fax no. (1-202) 477 0968.
7. Further Information
(a) Further Readings:
Chen, S., G. Datt, M. Ravallion. POVCAL: A Program
for Calculating Poverty Measures from Grouped Data. Poverty and Human
Resources Division, Policy Research Department, Washington DC: World Bank.
1992.
Ravallion, M., and S. Chen. What Can New Survey
Data Tell Us About Recent Changes in Living Standards in Developing and
Transitional Economies?. Working Paper 1. Research Project on Social and
Environmental Consequences of Growth-Oriented Policies, Washington DC:
World Bank.
Sen, A. On Economic Inequality. Oxford: Oxford
University Press. 1973.
The World Bank. World Development Indicators. Draft
Report. 1996.
| RATIO OF
AVERAGE FEMALE WAGE TO MALE WAGE |
| Social |
Chapter 3 |
State |
1. Indicator
(a) Name: Ratio of average female wage to
male wage.
(b) Brief Definition: Obtained as the
quotient of average wage rates paid to female and male employees at
regular intervals for time worked or work done for particular occupations.
(c) Unit of Measurement: %.
2. Placement in Framework
(a) Agenda 21: Chapter 3: Combating Poverty
(b) Type of Indicator: State.
3. Significance (Policy Relevance)
(a) Purpose: It is important to have an
assessment of remuneration offered women vis-a-vis their male counterpart
to ultimately determine the level of women's participation in the economy.
(b) Relevance to Sustainable/Unsustainable
Development: The lower the ratio of wages offered to women, the less
the attraction for women to join the labor force, which in turn deprives
the economy of a vital component of development. This disadvantage could
also be attributed to inequalities in educational opportunities for women
and the need for policy makers to correct this inequity. It is generally
acknowledged that if women are more educated, it is likely to result in a
corresponding reduction in infant mortality rates.
(c) Linkages to Other Indicators: The
indicator has close linkages with the unemployment rate indicator because
both deal with employment as a principal generator of production. It is
also closely linked to indicators pertaining to education.
(d) Targets: Not available.
(e) International Conventions and Agreements:
The resolution covering the institution of an integrated system of wages
statistics, including defined earnings and wage rates, was adopted by the
Twelfth International Conference of Labor Statisticians in Geneva in 1973
(see section 7 below).
4. Methodological Description and Underlying
Definitions
(a) Underlying Definitions and Concepts: The
UN International Labour Office (ILO) and the UN System of National
Accounts (SNA) provide two sources for this section.
i) The concept of earnings, as applied in wages
statistics, relate to remuneration in cash and in kind paid to employees,
usually at regular intervals, for time worked; or work done together with
remuneration for time not worked, such as for annual vacation, other paid
leave or holidays. Wage rates, as part of earnings, include basic wages,
cost-of-living allowances and other guaranteed and regularly paid
allowances, but exclude overtime payments, bonuses and gratuities, family
allowances and other social security payments made by employers. Ex gratia
payments in kind, supplementary to normal wage rates are also excluded (ILO).
ii) Wages and salaries, as part of compensation to
employees, are payable in cash or in kind and include the values of any
social contributions, such as income taxes, payable by the employee even
if they are actually withheld by the employer for administrative
convenience or other reasons and paid directly to social insurance
schemes, tax authorities, etc. on behalf of the employee. Wages and
salaries in cash include payments at regular intervals, supplementary
allowances payable regularly, payments to employees away from work for
short periods such as holidays, and ad hoc bonuses linked to performance,
commissions, gratuities and tips (SNA).
(b) Measurement Methods: The indicator is
measured by taking the average wage rates per day, week or month received
by female employees as a ratio of the corresponding average wage rates for
males. It could be classified further according to major divisions of
economic activity, for example, agriculture, mining and quarrying, etc.,
to facilitate measurement of sectoral impact on the development process.
Similarly, breakdowns according to age classes would provide additional
information related to sustainable development trends.
(c) The Indicator in the DSR Framework: This
indicator deals with the participation of labor in the economic process,
and stresses the importance of human activities to sustainable
development. It fits ideally within the DSR Framework as a State
indicator.
(d) Limitations of the Indicator: A serious
limitation is the reliability and comprehensiveness of wage rate data paid
to female labor. Although data is available for many countries, the
quality varies significantly among countries. Wage rates determine total
remuneration and measure women's contribution to total production.
However, since most of the basic remuneration for women's economic and
social activities remain unreported or unrecorded--and even if reported,
are grossly undervalued--only imputations are possible in many countries.
The indicator will be greatly influenced by the selection of wage sectors,
and type and level of job. The cost of collecting the data from
questionnaires and surveys can be significant.
Another limitation is that female wage rates do not
tell the whole story. Wages, particularly for females, may reflect
under-employment. Women, especially in developing countries, may
participate in informal activities where they are not classified as wage
earners. They do not receive income in the SNA sense and therefore these
activities are not covered by this indicator.
(e) Alternative Indicator Definitions: An
alternative indicator to the male-female wage would be the percentage
contribution of women to GDP which measures activities in the production
boundary that incorporate the contribution of women in the economic
process as proposed in the 1993 SNA. This would include the production and
processing of agricultural, dairy and fishery products and flour by
milling; weaving, dress making, production of footwear, baskets, mats,
etc.
5. Assessment of the Availability of Data from
National and International Sources
The average wage rates paid to female and male
employees provide the basic information to compile this indicator and are
mainly reported by departments or ministries of labor in most countries.
It is obtained either through questionnaires or surveys from the different
economic sectors of the economy. Average earnings are usually derived from
payroll data supplied by a sample of establishments together with data on
hours of work and on employment. Occasionally, wage indices are reported
in the absence of absolute wage data. In some other cases, information is
compiled on the basis of social insurance statistics. The extent of data
availability is published by the ILO in the Yearbook of Labor Statistics.
6. Agencies Involved in the Development of the
Indicator
The International Labor Office (ILO) is the
principal agency and contact point in the development of this indicator.
The contact is the Focal Point for Environment and Sustainable
Development; fax no. (41 22) 798 8685.
7. Further Information
The full text of the resolution listed in section
3e above can be found in Current International Recommendations on Labor
Statistics (Geneva 1988).
Further information can be obtained from other ILO
publications, as follows:
An Integrated System of Wages Statistics: A Manual
on Methods (Geneva 1979).
Statistical Sources and Methods; Vol. 2 Employment,
Wages and Hours of Work (Establishment Surveys) (Geneva 1987); Vol. 4
Employment, Unemployment, Wages and Hours of Work (Administrative Records
and Related Sources) (Geneva 1989).
|
